
If vLLM already solved LLM serving, why did SGLang appear?

Updated on
Published on
By

Table of Content
About the author

Most AI teams aren’t short on metrics. They’re short on answers.
This is a common failure mode in the modern AI tech stack, where dashboards exist but causal visibility is missing.
Your GPU dashboard shows utilization, the billing report shows your spend, and the latency graph shows response times. But none of them show why costs jumped last month, which workload was causing the cluster to throttle, or whether the deployment that went out this morning is actually performing the way it should.
Teams usually start solving this by treating the platform layer as AI infrastructure as a service instead of stitching together tools after incidents happen.
These aren’t monitoring gaps. This is the classic visibility problem. And it always gets significantly harder the moment AI infrastructure starts scaling beyond a handful of workloads and a single team.
High GPU utilization sounds like a good thing. But it could also mean your workloads are competing aggressively to create bottlenecks you haven’t caught yet. Low utilization, on the other hand, sounds wasteful. But it might be the right trade-off for a latency-sensitive deployment. The number alone doesn’t tell you the whole story.
According to a New Relic observability report, organizations running three or more disconnected monitoring tools take 40% longer to detect and resolve infrastructure incidents than teams with unified visibility. That gap tends to widen in AI environments, where the variables interact more frequently and are less predictable.
That’s because nothing in AI infrastructure is isolated:
Drop a new model into a shared cluster, and GPU utilization changes across the board. Add a retrieval-heavy workflow, and the infrastructure pressure looks completely different from a week ago. At that point, no single metric explains what’s actually happening. You end up correlating signals manually across multiple tools, trying to piece together why cluster efficiency shifted or where a cost spike came from. It’s slow (and frustrating), and it usually happens right when something already feels off.
Most teams today aren’t struggling to get GPU access. They’re struggling to figure out why the bill keeps climbing – and which workload, team, or configuration change caused it. And by the time the billing data shows up, the workload that caused it has already moved on.
Gartner’s latest Hype Cycle for Generative AI puts it plainly: at least half of all AI projects will blow past their budgets, with poor architectural choices and a lack of operational expertise leading the way. Once you’ve seen how shared GPU clusters behave in practice, that number makes complete sense.
Which is why cost visibility needs to sit inside infrastructure observability, not alongside it as a separate report. That means connecting:
Without those connections, cost optimization stays reactive. You see the outcome, but you rarely see the cause while you can still do something about it.
This is the same tension explained in the GenAI product trilemma, where teams end up trading off speed, control, and predictability.
Velocis builds observability into the infrastructure itself rather than treating it as a layer added later. GPU utilization, workload behavior, performance telemetry, and cost attribution all live in the same operational environment because, in a shared AI setup, they’re not actually separate problems to begin with.
In practice, that means:
For organizations running shared GPU clusters with multiple workloads, multiple teams, and real cost accountability, having all of that in a single operational view removes a significant amount of the manual correlation work that quietly eats up engineering bandwidth over time.
Every hour spent manually correlating dashboards, chasing down cost spikes, or debugging infrastructure behavior that should have been visible is an hour not spent on something that actually moves the product forward.
It adds up faster than most teams realize. A performance issue surfaces, two engineers spend half a day tracing it back through disconnected tools, and by the time they find the cause, the team has lost momentum on whatever they were actually supposed to be shipping. Multiply that across a quarter, and it’s a meaningful drag on how fast the team can move.
The teams that get this right aren’t just running cleaner infrastructure. They’re protecting engineering time. When visibility is built into the platform, the investigation work shrinks significantly – and the time that frees up goes back into iteration, experimentation, and building. Which, at the end of the day, is what the infrastructure was there to support in the first place.
Most teams come to Velocis after one too many hours spent manually correlating dashboards. If that sounds familiar, it’s a good time to take a look.
See how it works here or book your personalized product demo with our experts.
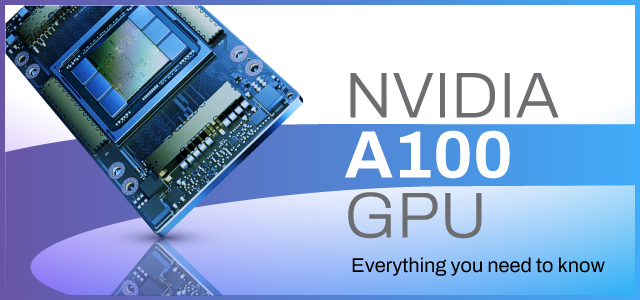
The NVIDIA A100 GPU, utilizing Ampere architecture, enhances AI and HPC performance through multiple advanced features like third-generation Tensor Cores and Multi-Instance GPU technology. It excels in diverse computational tasks, supporting various precision formats while ensuring scalability, cost-effectiveness, and flexibility for data centers, making it an essential investment for future-proofing AI infrastructure.
The landscape of GPU renting has shifted from training to inference, with Gartner predicting 55% of AI infrastructure spending in 2026 will focus on inference needs. GPU as a Service (GPUaaS) offers scalable, cost-effective access to GPU computing, catering to various workloads. Pricing models vary, accommodating operational demands and dynamic usage.